


Trading gold vs. other metals: insights for investors
- Shannon B
- Mar 5
- 13 min read


Gold accounts for over 90% of all precious metals trading volume globally, dwarfing silver, platinum, and palladium combined. This liquidity advantage shapes everything from execution costs to risk management for institutional portfolios. Yet many wealth managers still treat all precious metals as interchangeable portfolio hedges. Understanding how gold’s trading characteristics diverge from other metals helps you optimize capital deployment, reduce transaction friction, and align metal exposure with specific portfolio objectives.
Table of Contents
Key takeaways
Point | Details |
Gold delivers unmatched liquidity | Daily trading volume exceeds silver by seven times, enabling tighter spreads and lower slippage for large institutional orders. |
Volatility profiles differ sharply | Gold exhibits lower price swings during market stress while platinum and palladium face industrial demand shocks exceeding 20% annually. |
Distinct market drivers create price divergence | Geopolitical tensions elevate gold prices while automotive manufacturing cycles dominate platinum and palladium movements. |
Holding costs vary by metal characteristics | Storage, insurance, and transaction fees differ across metals, impacting net portfolio returns and liquidity strategies. |
Misconceptions lead to flawed allocation decisions | Assumptions about price correlation and universal safe-haven status misguide institutional metal selection and timing. |
Introduction to precious metals trading
Institutional investors allocate to four primary precious metals: gold, silver, platinum, and palladium. Each metal occupies a distinct market niche with varying liquidity, size, and portfolio function. Gold dominates with a global market exceeding $200 billion in daily turnover. Silver follows at roughly $30 billion daily, while platinum and palladium (collectively known as platinum group metals or PGMs) trail significantly with combined volumes under $5 billion.
These liquidity rankings directly influence execution quality and transaction costs. Deeper markets allow larger institutional orders without moving prices dramatically. Gold’s massive trading ecosystem spans physical bullion, exchange-traded products, futures contracts, and over-the-counter derivatives. This diversity provides multiple access points for portfolio managers seeking specific risk exposures or hedging strategies.
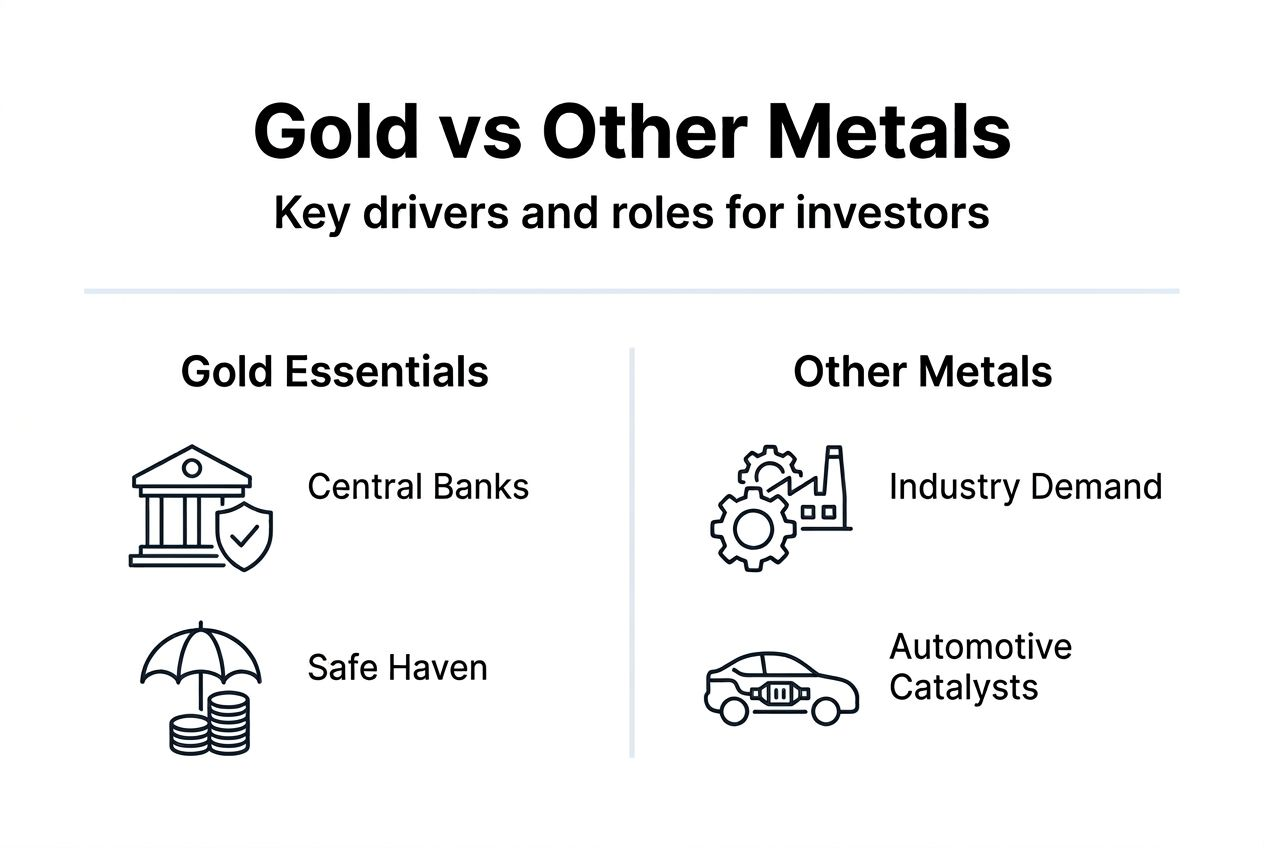
Institutional portfolios typically deploy gold as a geopolitical hedge and inflation buffer, while silver bridges monetary and industrial applications. Platinum and palladium serve primarily as industrial commodity exposures tied to manufacturing activity. Understanding operational mechanics of physical gold trading helps clarify execution pathways and settlement processes across these metals.
Trading formats split between physical delivery and paper instruments. Gold benefits from highly developed paper markets enabling efficient position scaling without storage logistics. Other metals face greater physical market constraints, particularly PGMs where supply concentration and industrial end-use limit derivative market depth. This structural difference affects how institutions build and adjust metal exposures within diversified portfolios.
Liquidity and market access comparison
Gold’s average daily turnover is more than seven times that of silver, underscoring its superior liquidity advantage for institutional trading. This volume gap translates directly into execution quality through tighter bid-ask spreads, reduced slippage on large orders, and faster position entry or exit. When portfolio managers need to deploy or withdraw capital rapidly, gold’s deep markets accommodate institutional order sizes without significant price impact.
Market depth varies dramatically across metals. Gold futures contracts on major exchanges routinely show order book depth exceeding 10,000 contracts at near-market prices. Silver depth runs approximately one-fifth of gold’s levels, while platinum and palladium often display thin order books vulnerable to price gaps on moderate-sized trades. These depth differences become critical during market stress when liquidity evaporates faster in smaller markets.
Liquidity comparison across precious metals:
Metal | Average Daily Volume | Typical Bid-Ask Spread | Market Depth Rating |
Gold | $200B+ | 0.02-0.05% | Excellent |
Silver | $30B | 0.08-0.15% | Good |
Platinum | $3B | 0.20-0.40% | Moderate |
Palladium | $2B | 0.25-0.50% | Limited |
Trading modalities also differentiate these metals significantly. Gold’s paper trading dominance through futures, options, and ETFs enables portfolio adjustments without physical logistics. You can scale positions efficiently using leveraged derivatives or unleveraged exchange products. Understanding the differences between physical gold and trading operations clarifies when each approach suits specific institutional objectives.
Platinum and palladium markets remain more physically constrained. Supply concentration in South Africa and Russia creates bottlenecks that limit paper market development. Industrial end-users demand physical delivery, reducing the derivative market share compared to gold. This physical bias increases transaction friction and holding costs for institutional investors seeking pure financial exposure.
Transaction cost advantages compound over time. Lower spreads and slippage on gold trades preserve more capital for portfolio growth. Over a typical five-year holding period, cumulative transaction savings from gold’s superior liquidity can enhance net returns by 50 to 100 basis points compared to less liquid metals. For large institutional allocations, these savings translate into millions of dollars in preserved capital.
Pro Tip: Calculate total cost of ownership including spreads, commissions, and market impact when comparing metal allocations. Gold’s liquidity advantages often offset higher per-ounce prices through lower execution costs, particularly for positions requiring frequent rebalancing or tactical adjustments.
Access to physical gold trading mechanics supports hybrid strategies combining paper instruments for tactical positioning with physical holdings for long-term strategic allocations. This flexibility exceeds what’s practical with smaller, less liquid precious metals markets.
Risk profiles and volatility dynamics
Historical volatility data over the past decade reveals gold’s relative stability compared to other precious metals. Gold’s annualized volatility typically ranges between 12% and 16%, while silver fluctuates between 20% and 30%. Platinum and palladium exhibit even wider swings, often exceeding 30% annually due to concentrated supply sources and demand sensitivity to specific industrial sectors.

Risk-adjusted returns favor gold during market stress periods. Gold’s Sharpe ratio during equity bear markets and geopolitical crises consistently outperforms other metals. This performance stems from gold’s dual role as monetary asset and safe-haven refuge. When investors flee risk assets, gold absorbs capital flows more efficiently than metals tied to industrial production cycles.
Geopolitical risk sensitivity creates distinct volatility patterns. Gold prices spike during political tensions, military conflicts, or currency crises as investors seek stores of value outside vulnerable fiat systems. Other metals show muted or even negative responses to geopolitical events when those crises threaten manufacturing activity or automotive demand.
Key volatility drivers by metal:
Gold volatility stems primarily from real interest rate changes, currency movements, and geopolitical uncertainty with limited industrial demand influence.
Silver volatility combines monetary demand sensitivity with industrial applications, creating hybrid behavior patterns harder to predict.
Platinum volatility tracks diesel vehicle adoption, emissions regulations, and South African mining disruptions more than broader economic factors.
Palladium volatility explodes during automotive production shifts, particularly gasoline vehicle manufacturing changes and catalyst technology transitions.
These volatility differences profoundly impact portfolio construction decisions. Gold serves as a portfolio stabilizer during market turbulence, reducing overall portfolio volatility when combined with equities or fixed income. Other metals often amplify portfolio volatility through industrial demand correlations with economic cycles, making them less effective diversification tools during synchronized market downturns.
Hedging strategies must account for these distinct risk profiles. Gold hedges currency debasement and geopolitical tail risks effectively. Platinum and palladium hedge manufacturing sector exposures but offer little protection during financial system stress. Silver occupies a middle ground, providing partial monetary hedge benefits diluted by industrial demand exposure.
Implementing effective risk management in gold investment requires understanding correlation patterns during various market regimes. Gold’s negative correlation with equities strengthens during bear markets, while other metals maintain positive equity correlation through economic cycle linkages. Recognizing key risks in institutional gold investing helps structure positions that deliver intended portfolio protection.
Pro Tip: Stress test metal allocations across multiple scenarios including stagflation, deflation, and geopolitical crisis. Gold typically protects portfolios across all three scenarios while other metals show scenario-dependent performance. Proper gold safeguarding strategies incorporate this reliability advantage into allocation decisions.
Market drivers and industrial demand effects
Geopolitical risk events create asymmetric price impacts across precious metals. Gold responds strongly to international tensions because central banks hold it as reserve assets and investors view it as politically neutral wealth storage. When conflicts escalate or sanctions fragment global payment systems, gold demand surges while industrial metals face demand destruction from disrupted manufacturing supply chains.
Central bank reserve policies amplify gold’s unique position. Over 35,000 metric tons of gold sit in official reserves globally, and central banks have been net buyers for over a decade. This institutional demand floor supports prices and creates persistent bid pressure absent in other metals. No comparable official sector demand exists for silver, platinum, or palladium.
Over 80% of palladium demand comes from automotive catalysts, causing price swings over 20% during vehicle manufacturing fluctuations. Platinum faces similar automotive exposure around 40%, with additional industrial applications in petroleum refining and chemical processing. These concentrated demand sources create correlation with manufacturing PMIs, auto sales data, and emissions regulation changes.
Demand composition and price sensitivity:
Metal | Jewelry/Investment | Industrial | Central Bank | Primary Price Driver |
Gold | 50% | 10% | 15% | Geopolitical risk, real rates |
Silver | 30% | 55% | 0% | Industrial activity, monetary demand |
Platinum | 25% | 70% | 0% | Automotive sector, diesel adoption |
Palladium | 10% | 85% | 0% | Gasoline vehicle production |
These divergent demand drivers produce non-correlated price movements over medium-term horizons. While short-term sentiment can move all metals in tandem, sustained trends reflect underlying demand fundamentals. Gold trends reflect monetary policy expectations and geopolitical developments. PGM trends track automotive manufacturing forecasts and technology shifts like electric vehicle adoption rates.
Strategic timing opportunities emerge from understanding these driver differences. When manufacturing indicators suggest automotive strength, platinum and palladium may outperform gold. Conversely, during geopolitical instability or monetary policy uncertainty, gold typically leads precious metals performance. Portfolio managers can rotate exposures based on evolving macro conditions and sector-specific developments.
Staying informed through market insights for precious metals helps identify inflection points where driver shifts justify allocation adjustments. Monitoring both geopolitical developments and automotive demand impact on palladium and platinum prices provides a comprehensive view of precious metals dynamics.
Cost considerations in trading and holding precious metals
Transaction costs vary significantly across precious metals markets due to liquidity differences and market structure. Gold’s tight bid-ask spreads of 0.02% to 0.05% minimize execution costs for institutional trades. Silver spreads widen to 0.08% to 0.15%, while platinum and palladium spreads can reach 0.25% to 0.50%. Over multiple trades or rebalancing cycles, these spread differences compound into material cost drag on portfolio returns.
Storage and insurance expenses reflect each metal’s physical properties and market conventions. Gold’s high value-to-weight ratio makes storage costs relatively low at 0.10% to 0.25% of position value annually for institutional vaulting. Silver requires roughly five times more storage space per dollar value, pushing costs to 0.50% to 1.00% annually. Platinum and palladium storage costs fall between these extremes but require specialized facilities due to industrial contamination concerns.
Key cost components to evaluate:
Physical delivery charges including transportation, assaying, and vault handling fees that vary by metal volume and value density
Insurance premiums scaling with metal theft risk and value volatility, typically higher for platinum and palladium due to concentrated supply chains
Custodial fees for segregated storage versus allocated pooled holdings, affecting audit costs and withdrawal flexibility
Tax treatment differences across jurisdictions where some metals face VAT or sales taxes while others receive exemptions
Paper trading modalities offer cost advantages for purely financial exposures. ETFs and futures contracts eliminate physical storage costs while maintaining price exposure. Gold’s mature ETF ecosystem provides low-cost options with expense ratios under 0.25% annually. Other metals have fewer ETF choices with higher expense ratios and tracking errors. This product availability gap favors gold for cost-efficient portfolio implementation.
Long-term holding period impacts amplify cost differences. A 10-year strategic allocation to physical platinum might incur cumulative costs exceeding 5% to 8% of position value through storage, insurance, and higher transaction costs. An equivalent gold position might cost 1.5% to 3% over the same period. These cost differentials affect hurdle rates for expected returns and inform metal selection decisions.
Understanding operational mechanics of physical gold trading reveals cost optimization strategies through efficient settlement processes and custodian selection. Comparing total cost of ownership across metals often justifies gold’s dominance in institutional portfolios despite higher per-ounce prices.
Common misconceptions about trading gold vs other metals
Many investors assume silver prices track gold movements reliably, creating a perceived arbitrage or leveraged gold exposure. This belief oversimplifies silver’s hybrid nature. Industrial demand constitutes over half of silver consumption, linking prices to manufacturing cycles and technology adoption. During economic expansions, silver often outperforms gold through industrial demand growth. Conversely, manufacturing contractions can suppress silver prices even when gold rallies on safe-haven demand.
The universal safe-haven assumption misleads portfolio construction. Gold functions as a safe haven specifically during geopolitical crises and currency debasement fears. During deflationary recessions or liquidity crunches, gold can decline alongside risk assets as investors liquidate to meet margin calls or raise cash. Other metals lack even this conditional safe-haven status, generally declining during any risk-off environment due to industrial demand destruction.
Correcting common misconceptions:
Precious metals do not move uniformly; correlations shift dramatically across market regimes with gold showing lowest correlation to equities during stress periods
Higher volatility in silver and PGMs does not automatically translate to higher returns; volatility often reflects downside risk rather than upside opportunity
Physical possession requirements differ across metals; gold’s established paper markets allow exposure without storage logistics, unlike platinum and palladium
Supply constraints affect metals differently; above-ground gold stocks exceed 20 years of production while PGM stockpiles are minimal, creating distinct supply-demand dynamics
Geopolitical event responses vary by metal in ways many investors misunderstand. Trade wars that threaten manufacturing hurt platinum and palladium through automotive demand concerns while supporting gold as a monetary hedge. Sanctions targeting specific countries can disrupt platinum and palladium supply chains since production concentrates in Russia and South Africa, but gold’s geographically diverse production mitigates similar supply shocks.
Price behavior during inflation episodes also defies simple assumptions. Moderate inflation driven by economic growth supports industrial metals through demand increases while potentially weighing on gold if real interest rates rise. High inflation accompanied by currency debasement or loss of monetary policy credibility strongly favors gold over other metals. Distinguishing these inflation types prevents misallocating based on headline inflation numbers alone.
Strategic applications for institutional portfolios
Gold’s liquidity advantage supports dynamic portfolio management strategies requiring frequent position adjustments. You can scale allocations rapidly in response to changing market conditions without incurring prohibitive transaction costs. This flexibility enables tactical overlays, risk parity implementations, and opportunistic trading around geopolitical events. Less liquid metals constrain similar strategies through higher execution costs and market impact.
Risk-adjusted portfolio optimization typically yields higher gold allocations than other precious metals. Gold’s lower volatility and superior liquidity generate better Sharpe ratios over full market cycles. Modern portfolio theory analysis generally recommends core precious metals exposure through gold, with satellite allocations to other metals for specific return drivers or diversification benefits.
Implementing strategic precious metals allocations:
Establish core gold position at 5% to 15% of portfolio value as geopolitical hedge and inflation buffer with rebalancing discipline.
Add tactical silver allocation at 1% to 3% to capture industrial demand growth during manufacturing expansions while accepting higher volatility.
Consider platinum or palladium exposure at 0.5% to 2% only if portfolio holds underweight positions in automotive or industrial sectors requiring hedge coverage.
Monitor correlation shifts quarterly and adjust allocations when metal relationships deviate significantly from historical patterns indicating regime changes.
Scale positions using cost-efficient instruments matched to holding periods with ETFs for shorter horizons and physical for multi-year strategic holdings.
Timing considerations differ across metals due to distinct market drivers. Gold allocation timing should align with monetary policy inflection points, currency regime shifts, or elevated geopolitical risk. Other metals require timing around manufacturing cycles, automotive production forecasts, and technology transitions affecting industrial demand. These different timing frameworks argue for separate decision processes rather than bundling all precious metals into single allocation choices.
Platinum and palladium complement gold exposure when portfolios need manufacturing sector hedges or anticipate automotive demand growth. These metals provide return sources uncorrelated with gold’s geopolitical and monetary drivers. However, their higher volatility and costs require smaller position sizes to avoid overwhelming portfolio-level risk budgets.
Diversification benefits across precious metals diminish during extreme market stress. Liquidity evaporates faster in smaller markets, forcing wider spreads and greater slippage precisely when portfolio protection matters most. Gold’s superior crisis liquidity makes it the primary precious metals diversifier, with other metals serving supporting roles during normal market conditions.
Leveraging gold as a safe haven asset requires understanding when safe-haven demand activates versus when other factors dominate. Comprehensive approaches that invest in gold for portfolio stability integrate this conditional behavior into allocation frameworks rather than treating gold as a static portfolio component.
Summary and practical next steps
Gold delivers unmatched liquidity, lower volatility, and reliable geopolitical risk hedging compared to silver, platinum, and palladium. These advantages translate into superior execution quality, reduced portfolio volatility, and more effective diversification during market stress. Transaction cost savings from tighter spreads and deeper markets compound over time, enhancing net returns for institutional allocations.
Other precious metals serve specialized portfolio roles when their distinct characteristics align with specific investment objectives. Silver provides hybrid monetary and industrial exposure suitable for manufacturing growth scenarios. Platinum and palladium offer targeted automotive sector hedges but lack gold’s monetary properties and crisis liquidity. Understanding these differences prevents misallocation based on oversimplified assumptions about precious metals as a homogeneous asset class.
Key actions for institutional implementation:
Establish gold as core precious metals allocation based on superior liquidity and risk-adjusted returns with strategic position sizing
Evaluate other metals as satellite positions only when portfolio construction requires specific industrial sector exposures or return drivers
Implement cost-efficient trading strategies leveraging gold’s developed paper markets while managing physical logistics for long-term strategic holdings
Monitor evolving market drivers across geopolitical, monetary, and industrial factors to identify rotation opportunities among precious metals
Galami Gold’s disciplined trading platform provides institutional investors with the infrastructure and expertise to optimize precious metals allocations. Our focus on transparent execution, risk management, and efficient capital deployment supports the strategic metal trading approaches outlined throughout this analysis.
Explore Galami Gold’s platform for institutional investors
Institutional gold trading demands secure infrastructure, transparent execution, and rigorous operational discipline. Galami Gold delivers these requirements through audited trading processes and established supply chain relationships that ensure execution quality and settlement certainty. Our platform enables portfolio managers to implement the strategic approaches discussed here with confidence in operational reliability.
Understanding why gold trading platforms matter helps you evaluate the infrastructure supporting your precious metals allocations. Our commitment to transparency and disciplined risk management aligns with institutional governance requirements and fiduciary standards. We provide the tools and market access needed to optimize gold exposure within diversified portfolios.
Explore our comprehensive gold investment strategy guide to deepen your understanding of portfolio integration approaches. Contact our institutional team to discuss how Galami Gold’s platform can support your precious metals objectives with the execution quality and operational rigor your portfolio demands.
Frequently asked questions
What factors make gold more liquid than other precious metals?
Gold’s massive global market with over $200 billion daily turnover creates unmatched liquidity for institutional trading. Extensive paper trading through futures, ETFs, and derivatives allows position scaling without physical logistics. Broad institutional participation from central banks, wealth managers, and hedge funds ensures consistent bid-ask depth across market conditions.
How do geopolitical events differently impact gold compared to platinum and palladium?
Gold prices surge during geopolitical tensions as investors seek safe-haven assets outside vulnerable fiat currencies and political systems. Platinum and palladium prices often decline during the same events because geopolitical instability disrupts automotive manufacturing and industrial production. This inverse sensitivity creates distinct hedging applications for each metal type.
What are common misconceptions about gold vs. silver price correlation?
Silver does not reliably track gold prices because over half of silver demand comes from industrial applications. Manufacturing cycles and technology adoption drive silver price divergence from gold, particularly during economic expansions or contractions. This hybrid demand profile creates lower correlation than most investors expect, limiting silver’s effectiveness as leveraged gold exposure.
Why consider other precious metals alongside gold in portfolios?
Platinum and palladium provide exposure to automotive and manufacturing sectors with demand drivers uncorrelated to gold’s geopolitical and monetary factors. Diversifying across metals can reduce portfolio concentration risk while capturing industrial growth opportunities. However, their higher volatility and costs require smaller allocations than core gold positions to avoid overwhelming portfolio-level risk budgets.
Recommended


Comments